Financial statements,
visualized.

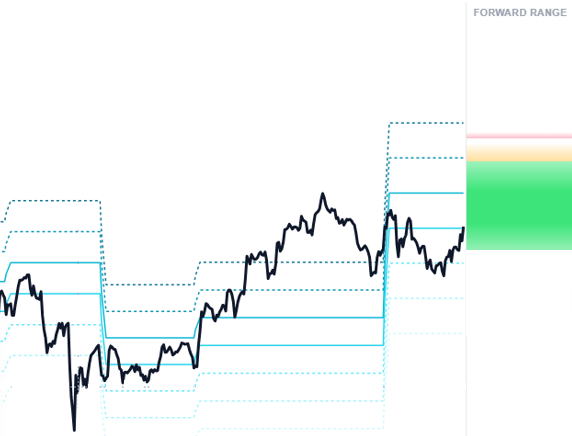
We overlay financial statement data directly onto a stock's price chart, including free cash flow, earnings, and book value ranges, turning core fundamental valuation multiples into chart-based indicators. These lines are fundamentally driven, but they behave like technical analysis signals helping you see when a stock is approaching important valuation inflection points. Paired with our signal system and written analysis, it forms a complete equity research output with global market coverage.

Try the PlatformHow it works
P/FCF · 3Y
P/FCF
P/B
P/E
EV/EBITDA
Price
28x
24x
20x
16x
12x
P/FCF Now
21.9x
↑ vs 3yr avg
Signal
Neutral
Fair value range
Some recommendations from our system this week:
AAPLNeutralMSFTFavorableNVDAFavorableGOOGLNeutralAMZNCautiousMETAFavorableTSLACautiousJPMFavorableVNeutralBRK-BNeutralCOSTFavorableNFLXNeutralAMDFavorableDISCautiousBABANeutralAAPLNeutralMSFTFavorableNVDAFavorableGOOGLNeutralAMZNCautiousMETAFavorableTSLACautiousJPMFavorableVNeutralBRK-BNeutralCOSTFavorableNFLXNeutralAMDFavorableDISCautiousBABANeutral
The Signal System

Valuation signal and forward range,
built for long-term investors.

Our signal system is designed for long-term investors focused on protecting capital and finding value at a fair price. It combines our chart-based valuation output with several additional crucial fundamental factors that influence a company's equity value, then converts that analysis into a favorable, neutral, or cautious signal. Then we present our forward range as tiered probability ranges on our charts.

This is not short-term market timing. Our goal is to identify fundamentally supported opportunities by combining valuation signals, empirical factor analysis, periodic validations of our signal quality, and our disciplined long-term investment focus.

Signal
Favorable
Valuation discount and improving fundamentals
Neutral
Fair value range
Cautious
Overvalued and/or deteriorating growth
Forward Range: Probability Zones
Most likely range
Core expected outcome, with valuation multiples shown
Possible
Less likely but plausible
Lowest likelihood outcomes
Tail scenario, low probability
Forward range chart sample
Price
$190.42
Signal
Favorable
P/FCF
21.4x
P/B
8.2x
P/E
29.1x
EV/EBITDA
22.8x
Fundamental Variables We Toggle Between On Our Charts
P/FCF
Price to Free Cash Flow
Measures how much investors pay per dollar of free cash flow generated by the business.
P/B
Price to Book Value
Compares market price to shareholders equity recorded on the balance sheet.
P/E
Price to Earnings
Stock price relative to reported earnings per share.
EV/EBITDA
Enterprise Value to Earnings Before Interest, Taxes, Depreciation & Amortization
A capital-structure-neutral multiple useful for comparing companies across debt levels and tax jurisdictions.
Written Analysis

Institutional-grade
written analysis,
behind the signal.

Each report output brings together our valuation charts, signal system, forward price range, and written research into one complete equity analysis file.

Our written research is designed to make institutional-style equity analysis accessible to everyday investors. Built by professionals with experience in major financial institutions, enhanced with AI-supported analysis, and human-reviewed for quality and judgment, our reports translate professional-grade market research into clear, visual, and actionable insights. All at a price point far below institutional subscriptions and research platforms.

Equity Research Report
Global Micro / Small /
Mid / Large Cap
Signal · Forward Range · Written Analysis
Favorable
Valuation Chart
Valuation Summary
Business Overview & Recent Developments
Forward Range Rationale
Human-reviewed
AI-assisted
Institutional structure
Global coverage

Rigorous analysis.
Fundamentals, the way they should be understood.

We covered our core concept, but the platform goes much deeper. Here are some of our other favorite features you will find inside the platform.

Fundamental Factors
A curated table of high-impact financial metrics selected for their relevance to equity price behavior. Instead of overwhelming users with every possible data point, we focus on the factors that matter most: profitability, cash flow, balance sheet strength, growth, ROIC, valuation, and other key signal system inputs.
DCF Sensitivity Sampler
Our Discounted Cash Flow sensitivity tool helps users understand what the market may already be pricing into a stock, using another core financial approach to valuation. We provide an estimated Weighted Average Cost of Capital and show how changes in growth, margins, discount rates, and terminal assumptions can impact implied valuation.
Discovery & Market Pulse
Explore the most-viewed reports by day or week across every global region we cover. Track recently changed Favorable and Cautionary signals to stay on top of emerging trends, shifting sentiment, and discover new stock picks across the global markets, before the crowd catches on.
Watchlist & Alerts
Track the companies you care about most. Get notified when new reports are published, valuation ranges change, signals update, or important company developments are reflected in the platform.
Education
A growing library of finance and investing knowledge designed to help users become better analysts. Learn key concepts around valuation, financial statement analysis, ratios, risk, markets, and the fundamentals behind our signal framework.
Model Portfolios
Our signal system supports the creation of model portfolios where users can track live performance, holdings, and trades as they happen. Users are notified when portfolios are updated so they can follow along, study the process, and better understand portfolio construction in a practical way.
Tools
Additional tools designed to help users complement our signal system and learn more about the markets. Tools include our options market signal indicator and a screener to test stock picks more deeply, investigate investment theses, and explore setups beyond the core output.
Validations
On approximately a six-month basis we publish validation studies quantifying how our signal system has performed. We examine the recommendation the signals made and assess whether the price movement was in line with the recommendation. This allows us to transparently share with users how the platform has been helping make sound investment calls.
Pricing
Basic
$14.99$9.99/mo
  • Popular tickers of the week
  • Recent top signal changes on the platform
  • 2 full output files per week
  • Limited watchlist
  • Education library, full access
  • Email updates & reminders
Get Started
MOST POPULAR
★ Founding Analyst Promotion
Limited spots: if you're seeing this, you're still in time!
Analyst
$39.99$29.99/mo
  • Founding Analyst promotion: free upgrade to Researcher tier when Model Portfolios go live (available to all early supporters signing up now)
  • Full platform access, global equity coverage
  • Unlimited output files across all global equities (fair-use rate limits may apply in rare cases)
  • Watchlist with email alerts
  • Future Add-On Tools Access
Get Started
Researcher
$54.99$44.99/mo
  • Everything in Analyst
  • Priority requests and uncapped limits
  • Model Portfolios, full access
  • Monthly market newsletter
  • Early access to new features
Get Started

Prices in USD.

Monthly Freebies

Read a free output file

See exactly what our platform produces on any major stock across global exchanges. We refresh these monthly so we'll keep you updated when a new one is posted.

AAPLNeutral

Apple Inc.

Large Cap · Technology · North America

Read full output file →

New sample coming soon.

Free Research

Start seeing the market clearly.

Try the PlatformContact Us